
NFL Red Zone Efficiency and Prop Market Impact
 Available in US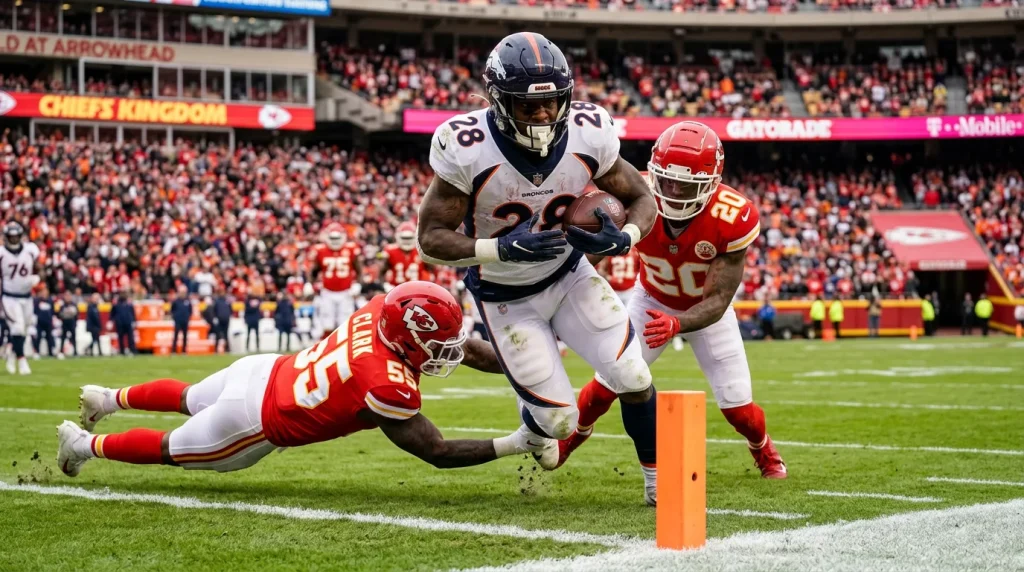
Three separate Sundays in the 2024 season, I bet on the same running back to score a touchdown. All three times his team reached the red zone at least three times. He scored zero touchdowns across those three games. The team’s quarterback ran it in twice, the fullback punched one in, and a wide receiver caught a fade route for the fourth. I was right about the team’s red zone trips. I was wrong about who would finish the job. That distinction — between team-level opportunity and player-level conversion — is the entire game within NFL red zone props.
The red zone, that 20-yard strip before the end zone, compresses everything about football into a smaller space. Defensive coverage tightens, running lanes shrink, and the decisions an offensive coordinator makes about who touches the ball are more concentrated and more revealing than anywhere else on the field. If you want to bet on touchdowns and goal-line outcomes intelligently, the red zone is where the answer lives.
Identifying players with high red-zone target shares is the most reliable way to find value in an NFL touchdown scorer bet.
Target Metrics – Differentiating Red Zone vs Overall Share
Here is a fact that changed how I bet touchdown scorer props: a player’s red zone target share often looks nothing like his overall target share. The receiver who leads the team in targets across the full field might rank third or fourth in red zone targets because his route tree — the types of routes he runs — is not suited to the compressed space near the goal line.
Speed receivers who thrive on deep routes and yards after catch often see their red zone role diminish. There is no room for a deep post route when the end zone is 8 yards away. Conversely, big-bodied receivers and tight ends who may not lead the team in overall targets become primary weapons in the red zone because they win contested catches in tight coverage. A tight end who sees 14% of the team’s overall targets might command 30% of the red zone targets because his size advantage over linebackers and safeties becomes decisive in close quarters.
I maintain a separate red zone target share column in my tracking spreadsheet for exactly this reason. When evaluating an anytime touchdown scorer bet, overall target share tells me about a player’s general involvement. Red zone target share tells me about his touchdown probability. These are different questions with different answers, and conflating them is the fastest way to misprice a scorer prop. Bill Miller of the American Gaming Association put it well when he noted that the growth in prop markets reflects bettors wanting more granular ways to engage with games — red zone target share is exactly that kind of granularity.
Goal-Line Carries: The Running Back Touchdown Lottery
Who gets the ball at the 1-yard line? This single question determines more touchdown scorer bets than any statistical model. And the answer is often not the team’s featured running back.
NFL teams have become increasingly specialised in their goal-line personnel. Many teams use a dedicated short-yardage back — a heavier, more powerful runner who enters the game specifically inside the 5-yard line. The featured back, who might carry the ball 18 times during the game, stands on the sideline and watches the goal-line specialist score. The featured back’s overall workload is irrelevant at the goal line if he does not get goal-line snaps.
Tracking goal-line snap percentage is the single most important data point for running back touchdown props. Over the 2025 season, $30 billion was wagered on NFL across the US market alone, and a meaningful slice of that money went into touchdown scorer markets where bettors were picking the wrong back because they did not check who actually lines up inside the 5. A running back who plays 70% of his team’s overall snaps but only 40% of goal-line snaps is not a strong anytime TD bet relative to the specialist who plays 80% of those goal-line snaps but barely appears elsewhere.
Quarterback sneaks add another wrinkle. Some quarterbacks — particularly in the current era of mobile, athletic signal-callers — are their team’s most efficient goal-line scorer. A team whose quarterback has scored six rushing touchdowns from inside the 2-yard line is a team where the running back’s touchdown upside is capped, regardless of how many times the team reaches the red zone.
Defensive Red Zone Efficiency and What It Means for Overs
Not all defences are equal when the field shrinks. Some units that perform well in the open field collapse inside the 20 because their scheme relies on speed and coverage depth that the red zone eliminates. Other defences that look mediocre in general statistics become brick walls near the goal line because their front seven is built for physicality in tight spaces.
I check two numbers for every defence when evaluating red zone props. The first is red zone touchdown percentage allowed — the percentage of opponent red zone trips that result in touchdowns rather than field goals or turnovers. The league average sits around 55-60%, but the range is wide. The best red zone defences allow touchdowns on barely half of opponent red zone trips. The worst allow touchdowns on 70% or more. That 20-point spread creates meaningful differences in touchdown probability for the players involved.
The second number is red zone plays per trip. A defence that forces three-and-outs inside the 20 (rare but it happens) limits the total red zone snaps available to opposing skill players. A defence that bends and allows extended red zone drives — multiple plays inside the 20 before the offence scores or turns it over — gives every offensive player more chances to accumulate red zone stats and score.
When a high-volume offence meets a poor red zone defence, the touchdown market tilts sharply toward overs. The question is not whether touchdowns will be scored but which players will score them. Red zone target share and goal-line snap data answer that question far more reliably than overall season statistics.
Maximize your scoring market returns with the analytical tools available at NFL Player Betting.
Same-Game Parlays and Red Zone Correlation
Red zone analysis becomes especially powerful when building same-game parlays because red zone outcomes correlate in ways that boost parlay probability. A game projected for a high total — say, 52.5 points — implies roughly seven to eight total touchdowns. In that environment, multiple players on both teams are likely to score, which means combining two or three anytime touchdown scorers from the same game is less speculative than it sounds.
The correlation works like this: if both teams are projected to score 26+ points each, the total number of red zone trips across the game is likely to exceed eight or nine. Each trip represents an opportunity for a specific player to score, and the players with the highest red zone involvement have repeated chances rather than a single shot. Combining the top red zone target on each team in a same-game parlay is a bet on game flow matching the projection — high scoring, multiple red zone trips per team, and the most involved players converting at least once each.
The risk is obvious: a low-scoring game kills the entire parlay. If the defence dominates or turnovers suppress red zone trips, neither player scores and the bet is dead. I only build these parlays in games where the total is set at 48 or above and the spread is within a touchdown, because those parameters project the balanced, high-scoring environment where multi-scorer parlays are most likely to land.
When Red Zone Data Misleads
Red zone statistics are powerful but not infallible. The biggest trap is small sample size. By mid-season, a team might have only 30-40 red zone trips — and an individual player’s share of those trips might be based on a handful of plays. Drawing firm conclusions from six or seven red zone targets over eight games is shaky. I weight red zone data more heavily in the second half of the season when the samples are larger, and rely more on overall usage patterns and scheme analysis earlier in the year.
Injuries scramble everything. A team’s red zone pecking order can change overnight if the top receiver goes down or a new running back enters the rotation. Last season’s red zone data is nearly useless if the offensive personnel has turned over, and even current-season data needs updating weekly as roles shift. Treating red zone stats as a living document rather than a fixed reference is essential — the punters who update weekly outperform those who set their models at the start of the season and coast.
What is the difference between red zone target share and overall target share?
Red zone target share measures what percentage of a team"s pass attempts inside the opponent"s 20-yard line go to a specific player. This often differs dramatically from overall target share because the compressed field favours different player types — big-bodied receivers and tight ends tend to see increased red zone involvement compared to their full-field role.
How do I find which running back gets goal-line carries?
Track goal-line snap percentages, which show which back is on the field inside the 5-yard line. Many teams use a dedicated short-yardage specialist rather than their featured back for these carries. This data is available through NFL play-by-play logs and is the most important factor in evaluating running back touchdown props.
Articles
Published by the NFL Player Betting team.
