
Using NFL Game Scripts to Predict Player Prop Value
 Available in US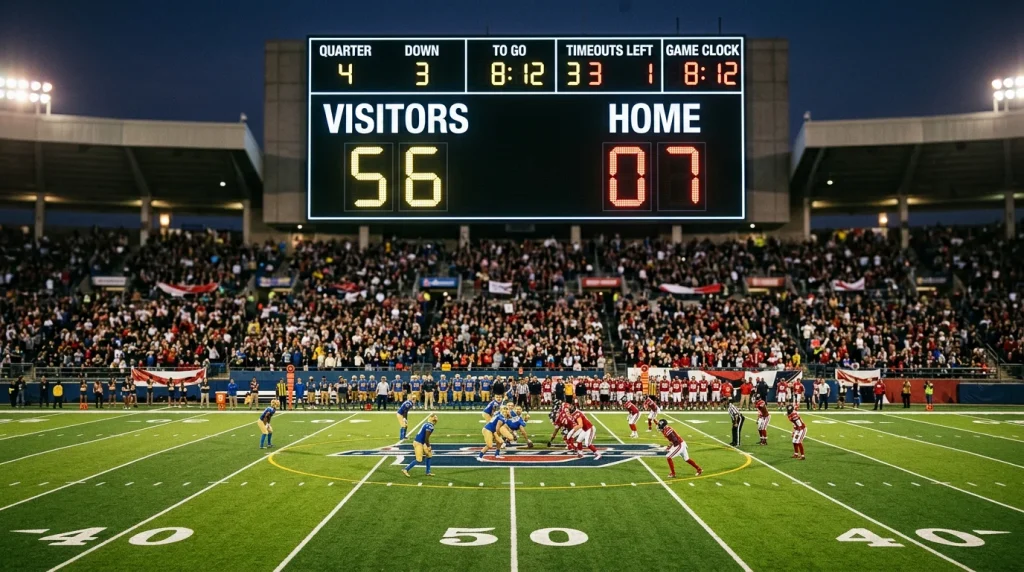
Game script is the invisible hand behind every NFL player prop. It determines who throws, who runs, and who disappears from the stat sheet. I have watched a running back projected for 80 yards finish with 34 because his team fell behind by three scores in the first half and never ran the ball again. I have seen a backup wide receiver nobody was talking about catch nine passes for 110 yards because his team was in permanent catch-up mode. The players did not change. The game script changed everything around them.
Understanding game script is not optional for prop bettors — it is the foundation. Every other piece of analysis — matchup, talent, historical averages — sits on top of this base. If you get the game script wrong, the rest does not matter.
Flow Prediction – Leveraging Spreads to Model Game Script
Before I look at a single player prop, I look at two numbers: the spread and the total. Together, they tell me more about the expected game environment than any other data point.
The spread tells me which team is expected to lead. A team favoured by 7 points is projected to control the game, which means more rushing attempts in the second half, fewer desperation throws, and a clock-management approach that suppresses overall play volume. The underdog, conversely, is projected to trail, which historically means more passing attempts and fewer rushing touches as the game progresses.
The total — the combined expected score of both teams — tells me about pace and volume. A total of 51.5 projects a high-scoring, fast-paced game with more offensive plays for both sides. A total of 38.5 projects a defensive struggle with fewer possessions and lower stat ceilings for individual players. Live and in-play betting now accounts for over 62% of the online wagering market, and that share reflects how closely bettors are following game flow in real time. But the smart work happens before kickoff, when the spread and total are your best forecasting tools.
Here is how I combine them. A game with a high total and a tight spread — say, 52.5 with a 2.5-point spread — projects a shootout where both teams will throw often and score frequently. Passing props on both quarterbacks trend toward the over side. A game with a low total and a wide spread — say, 39.5 with an 8.5-point spread — projects a one-sided grind where the favourite runs the ball and the underdog’s offence struggles. The favourite’s running back trends toward his over; the underdog’s quarterback trends toward his under because his team will not have enough productive possessions to generate volume.
This framework is not a guarantee — games deviate from projections constantly — but it sets the baseline expectation. Every prop line is set against an implied game script, and when your projection disagrees with the implied script, that is where the betting edge lives.
The Trailing Team Effect: Pass Volume Spikes in Negative Game Script
I call this the desperation dividend. When a team falls behind by 10 or more points in the second half, the play-calling shifts dramatically. The running game is abandoned. The quarterback drops back on nearly every play. Wide receivers and tight ends see target counts spike. The stat lines that result can look like a great performance on paper, but they are a product of circumstance, not dominance.
The numbers are striking. Quarterbacks on teams trailing by two or more scores in the fourth quarter average roughly 15-20% more passing attempts per game than their baseline. Those extra attempts do not come with equivalent efficiency — completion rates often dip because the defence knows the pass is coming and plays accordingly. But the raw volume inflates passing yards, completions, and especially target counts for top receivers.
For prop betting, the trailing team effect creates a specific opportunity: passing props on the underdog’s skill players. If a team is a heavy underdog — say, a 9-point dog — the market expects them to trail for most of the game. Their quarterback’s passing yards line should already reflect the projected volume spike, but it does not always do so fully. Bookmakers set lines using a blend of season averages and game-specific adjustments, and the weighting on the game-specific side is not always heavy enough. When I see a quarterback whose season average is 230 passing yards but whose line for a game as a 10-point underdog is set at 240, I ask whether the trailing team effect alone could push him past 250 — and often, the answer is yes.
The flip side is running back props on the trailing team. A running back whose team is expected to trail sees his carry projection drop, sometimes drastically. If the back does not have a significant pass-catching role, his involvement in the game might be limited to the first half before the team abandons the run. His rushing yards line may reflect his season average rather than the specific game environment, creating an under opportunity. I covered the mechanics of how this affects rushing markets in my rushing yards props evaluation.
Blowouts and Garbage Time: When Backup Players Hit Prop Lines
The strangest prop result I ever tracked was a backup quarterback who entered a game in the fourth quarter of a 35-10 blowout and threw for 140 yards in twelve minutes. He was not on any prop sheet. But if he had been, his performance would have smashed any line the book could have set, because garbage time operates under completely different rules than competitive football.
When a game is effectively decided — a margin of 21 or more points in the fourth quarter — both teams shift their approach. The winning team rests starters and runs the clock. The losing team may continue to throw, but against a defence playing soft coverage designed to prevent big plays and let the clock run. The result is a peculiar environment where passing yards accumulate for the losing team’s players even though the game is over in all but name.
NFL average viewership hit about 18.6 million per game in the 2025 season, and those viewers watch through blowouts because of fantasy football and prop bets. The prop market knows this — garbage time stats count toward settlement. A wide receiver who catches six passes for 70 yards in meaningful time and then adds three catches for 40 yards in garbage time finishes with nine catches for 110 yards. The prop settles on the full-game total regardless of when the stats were accumulated.
This creates two opportunities. First, receiving and passing props on the trailing team’s starters benefit from garbage time volume if the starters stay in the game. Not all teams pull their starters in blowouts — some coaches let the quarterback continue throwing to build rhythm or evaluate young players. Checking a team’s historical tendency in blowout situations is worth the effort. Second, backup players occasionally accumulate meaningful stats in garbage time. This is harder to exploit because backup props are rarely listed, but when they are — typically in high-profile games — the lines are set low and the potential for a garbage-time breakout is not priced in.
The risk is obvious: garbage time is not guaranteed. A blowout that looks certain at the end of the third quarter can tighten if the trailing team scores quickly, which shifts the winning team back into competitive mode and reduces the volume of garbage-time possessions. I only factor garbage time into my prop analysis when the spread is wide enough — typically 10 or more points — to make the blowout scenario a significant probability rather than a fringe outcome.
How does a high total line indicate more player prop value?
A high game total projects more offensive plays, more points, and more statistical volume for both teams. When the total is set at 50 or above, both quarterbacks are expected to throw more often, which lifts passing, receiving, and scoring props across the board. Higher totals create a larger statistical pie, which increases the likelihood of individual players exceeding their prop lines.
Should I target passing props on teams expected to trail?
Yes, but with nuance. Teams expected to trail project for more passing attempts as they play from behind, which inflates passing yards and target counts. However, the efficiency of those passes often declines because the defence adjusts to the expected pass-heavy approach. Look for situations where the passing volume spike is not fully reflected in the player"s prop line compared to their season average.
Articles
Written by the editors at NFL Player Betting.
